
 Business
 INDIA
INDIA Stocks
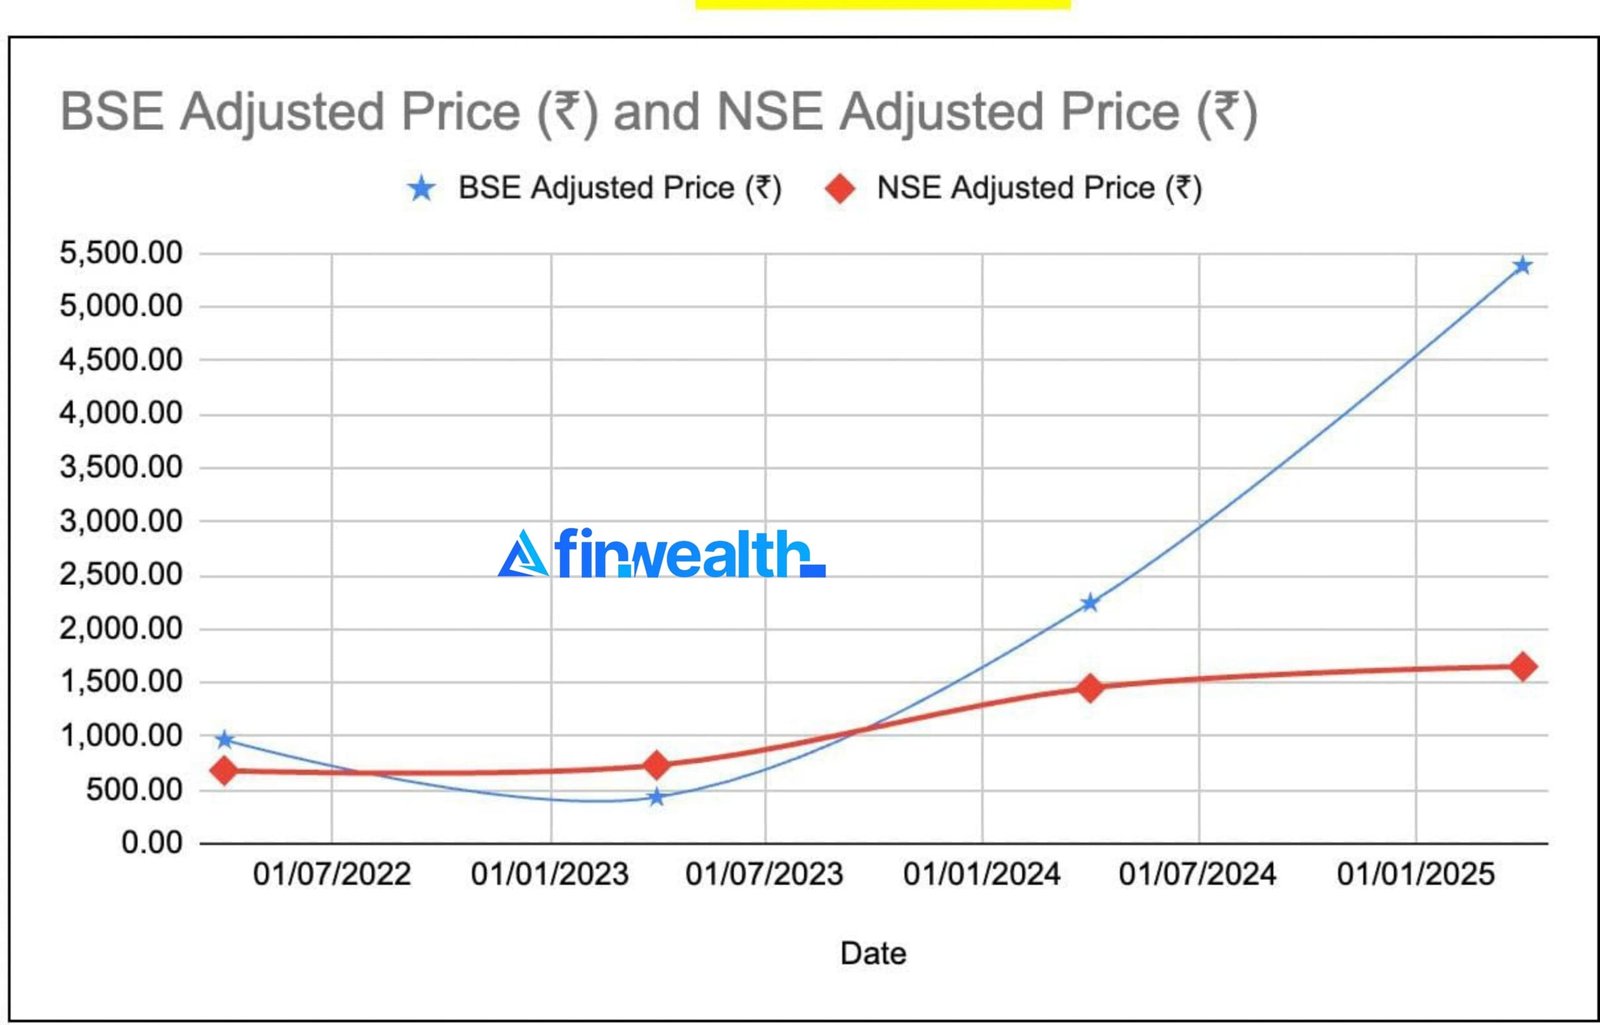
The chart highlights BSE’s dramatic growth, but NSE’s flatter curve suggests room for upside, Key reasons, reinforced by the chart:
Undervaluation:
NSE’s PE (30) is lower than BSE’s (91), despite NSE’s 93% market share vs. BSE’s 7%. The chart’s flatter NSE line indicates it hasn’t matched BSE’s re-rating.
IPO Catalyst:
BSE’s rally post-2017 listing suggests NSE could see a similar surge upon IPO (expected within 2 years). The chart’s NSE price (₹1,650) is below its 52-week high (₹1,800, Jan 2025), offering an entry point.
Liquidity Premium:
BSE’s listed status drives its volatility and growth (chart’s sharp peaks/dips). NSE’s unlisted shares lack this liquidity, but listing could align its price closer to BSE’s multiples.
Market Dominance:
NSE’s ₹4.7 lakh crore valuation dwarfs BSE’s ₹85,334 Cr, yet its share price growth (142.65%) lags BSE’s (457.01%). This gap suggests revaluation potential